Quick answer
To see traffic on an AI-published website: publish on GeminiLaunch, upgrade to Pro or Scale, and open Website analytics in the dashboard. You’ll get page views, visitors, a daily chart, top pages, countries, and traffic sources for 7 / 30 / 90 days — no Google Analytics tag required. Free still lets you go live; analytics unlock with paid plans. Related: pricing, features.
Why it matters
A live AI site without traffic data is a guess
You paste code from ChatGPT, Claude, or Gemini, hit publish, and share the link. Clients ask “is anyone visiting?” Freelancers wonder which portfolio page works. Founders wonder if a Product Hunt or LinkedIn post did anything.
Without analytics you only have anecdotes. With a simple dashboard you can answer in one screen: how many views, roughly how many people, which pages, which countries, and which referrers — then decide what to fix next.
Google’s own guidance for Google Analytics is built for marketing stacks and property setup. Many AI-published landing pages do not need that weight on day one — they need a clear traffic picture next to the sites they already host.
Publishing ≠ knowing whether anyone opened the URL
Views show activity; visitors help estimate reach
Sources and countries show whether your share strategy worked
Built-in host analytics skip pasting tags into AI-generated HTML
Scope note
This article is about traffic analytics after publish. It is not about writing page titles or Open Graph images — that lives in a separate guide so the keywords stay distinct.
Compare
Four ways people measure AI website traffic
Honest options for 2026 — from built-in host analytics to full GA4 setups.
| Option | Method | Setup | Best for |
|---|---|---|---|
| GeminiLaunch analytics (Pro/Scale) | Built into the dashboard — no script in your HTML | Upgrade → open Analytics | AI-published static sites when you want answers without GA setup |
| Google Analytics 4 | Add a measurement tag / gtag to every page | Property + stream + paste snippet | Marketing teams that need funnels, ads attribution, and GA reports |
| Privacy-first scripts (e.g. Plausible) | Lightweight third-party script in your layout | Account + domain + paste | Cookieless dashboards when you already manage your own HTML head |
| No analytics | Publish and guess | None | Throwaway demos — not client work or launch pages |
Metrics
What each GeminiLaunch analytics number means
On Pro and Scale the dashboard shows account-wide stats for the range you select.
Total views
How many times pages on your published sites were loaded in the selected range
Use it to: Spot whether a launch, share, or client email actually moved traffic
Visitors
Approximate unique people in that same window (not the same as raw page loads)
Use it to: Tell repeat refreshes apart from real reach when you share a link
Views per day & today
Average daily volume plus today’s count (UTC)
Use it to: Catch a spike the day you post on LinkedIn or send a client link
Top pages
Which paths get the most visits across your account
Use it to: Double down on pages that work; fix or retire quiet ones
Top countries
Where visitors appear to be browsing from
Use it to: Check that the audience matches who you marketed to
Traffic sources
Referrers / how people arrived (when the browser sends that signal)
Use it to: See which share channel or site actually sent clicks
Step-by-step
From published AI site to a traffic dashboard
Most people who already published only need the upgrade step — then five minutes of reading the charts.
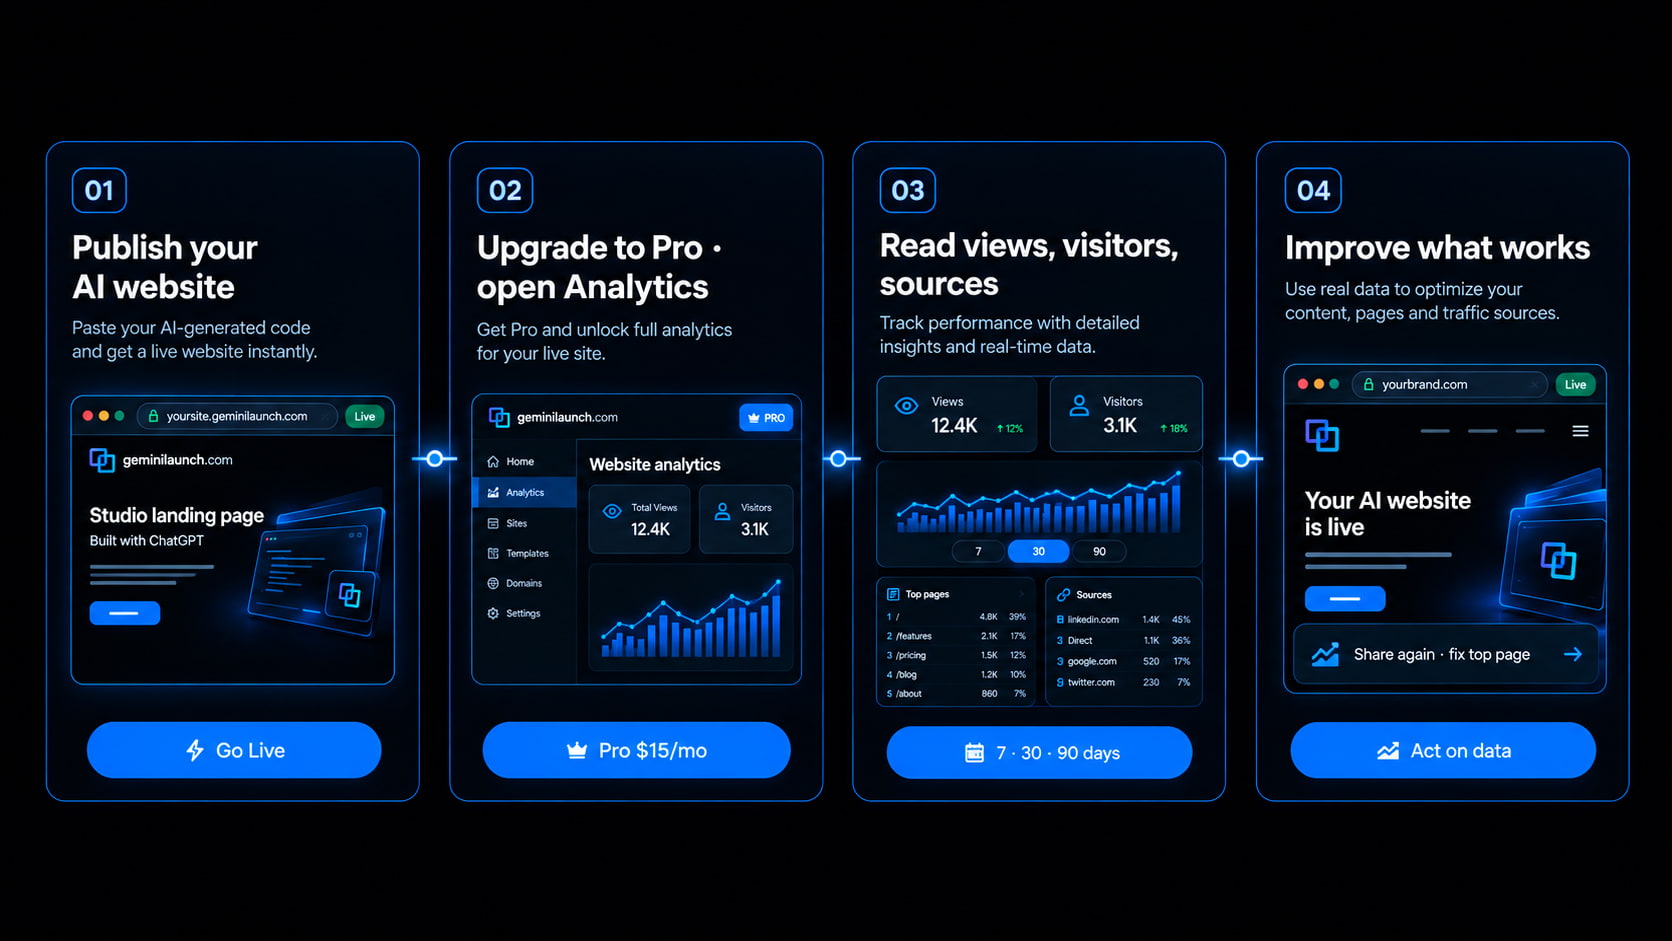
Publish your AI site first
Paste ChatGPT, Claude, or Gemini HTML/React into GeminiLaunch — or upload a ZIP/folder with index.html — and click Go Live. Analytics only apply to published sites people can actually open. Free still gives you a public HTTPS URL; traffic insights unlock on Pro and Scale.
Tip: Share the free subdomain with a friend or open it in a private window once. That confirms the site is live before you dig into numbers.
Upgrade to Pro (or Scale) and open Analytics
In the dashboard, go to Website analytics. Free accounts see an upgrade panel; Pro and Scale unlock the full view: tiles, daily chart, and breakdowns. Numbers cover every site on the account for the range you pick — 7, 30, or 90 days.
Tip: Pro is $15/mo and also includes editing after publish, no badge, and up to 5 custom domains. Analytics is one reason to upgrade — not the only one.
Read views, visitors, pages, countries, and sources
Start with total views and visitors for the range. Then scan top pages (what people open), countries (where they are), and traffic sources (how they found you). Use the daily chart to spot launch-day spikes versus quiet weeks.
Tip: Empty panels are normal on a brand-new site. Metrics fill in as real visitors arrive — not while the page only exists as a draft in chat.
Act on what the data shows
If one path dominates, improve that page’s content or CTA. If a share channel shows up in sources, post there again. If almost nobody visits after a client send, check the URL, DNS, or whether you shared a preview instead of the live link.
Tip: Pair traffic with a clear page title and social preview so links look trustworthy when shared — that setup is covered in our SEO title & Open Graph guide, not here.
Avoid these
Common mistakes with AI website analytics
Expecting analytics on Free
You can publish live sites for free. The analytics dashboard — views, visitors, sources — is a Pro and Scale feature. The Free upgrade panel is intentional, not a bug.
Confusing analytics with SEO tags
Title, meta description, and Open Graph images help how the link looks in search and chat previews. Analytics answers who showed up afterward. They are different jobs.
Judging a site after one quiet hour
A new URL often has near-zero traffic until you share it. Use 7-day range after a real send (client email, LinkedIn, Product Hunt) before deciding the page “failed.”
Pasting a GA script when you only needed a simple dashboard
GA4 is powerful and heavier to set up. For many AI landing pages, built-in host analytics are enough. Add GA later if you need ads funnels or cross-site marketing reports.
Be fair
When Google Analytics (or Plausible) is still the right call
Stay with a dedicated analytics product when:
You run paid ads and need campaign / UTM funnels inside GA4
Your company already standardizes on Google Analytics or a privacy-first SaaS
You need event tracking beyond page views (checkouts, signups wired in code)
You host across many platforms and want one cross-host report
If you only need to know whether your GeminiLaunch-hosted AI page is getting visits after a share — Pro analytics is the shorter path.
Related guide
AI website SEO: title & Open Graph
Make links look right in search and chat — separate from traffic stats.
Read the guideRelated guide
How to publish AI-generated websites
Get the site live first — then come back for analytics.
Read the guideRelated guide
Custom URL for an AI website
Connect yourbrand.com, then watch branded traffic in analytics.
Read the guideFAQ
Frequently asked questions
Direct answers about traffic analytics on AI-published sites.
How do I see traffic on my ChatGPT or Claude website?
Publish the site on GeminiLaunch, upgrade to Pro or Scale, then open Website analytics in the dashboard. You’ll see views, visitors, top pages, countries, and traffic sources for 7, 30, or 90 day ranges — no Google Analytics script required.
Does GeminiLaunch include website analytics?
Yes on Pro and Scale. Free accounts can publish live sites; the analytics dashboard unlocks with a paid plan. Account-wide tiles and charts cover every site you publish.
Do I need to paste a tracking code into my HTML?
Not for GeminiLaunch analytics. Traffic is collected for sites hosted on the platform. You only add a third-party script (like GA4) if you choose an external tool on purpose.
What is the difference between views and visitors?
Views count page loads. Visitors approximate unique people in the selected window. One person refreshing a page can raise views more than visitors — useful when you share a link once and watch for real reach.
Can I see which country or referrer sent traffic?
Yes on Pro and Scale. Top countries and traffic sources appear as ranked lists alongside top pages. Source data depends on what the visitor’s browser sends as a referrer.
Is AI website analytics free?
Publishing can be free. Built-in traffic analytics are included with Pro ($15/mo) and Scale ($39/mo), not Free. That keeps Free focused on going live quickly.
When should I use Google Analytics instead?
Use GA4 (or similar) when you need ad campaigns, multi-step funnels, or company-wide reporting that already lives in Google. For “did anyone open my AI landing page?” host analytics are usually faster to set up.
Will analytics work on a custom domain?
Yes. Sites on free GeminiLaunch subdomains and Pro/Scale custom domains are included in the account analytics once they are published and receiving visits.
Why is my analytics dashboard empty?
New sites need real visitors after publish. Confirm the public URL loads, share it, then wait for the next visits to appear. Also confirm you are on Pro or Scale — Free shows the upgrade panel instead of charts.
Does this replace setting a page title or social preview image?
No. Analytics measure traffic after people click. Titles and Open Graph images shape how the link looks before they click — see our AI website SEO title & Open Graph guide for that setup.
Like this guide? Make GeminiLaunch a preferred source.
Get our hosting and deployment guides surfaced first in your Google results, AI Overviews, and Top Stories.
Stop guessing who visited your AI site
Publish free on GeminiLaunch, then unlock views, visitors, and sources on Pro — without pasting a tracking script into your AI HTML.
Analytics on Pro & Scale · publish starts free